In Scotland we've just had the
second hottest summer on record. As the month wore on more and more cloud accompanied those high temperatures and July closed with some beautiful thunderstorms. I was tickled to see them showing up in the measurements from our little
Callisto radio telescope, mentioned in
an earlier post, e.g.:
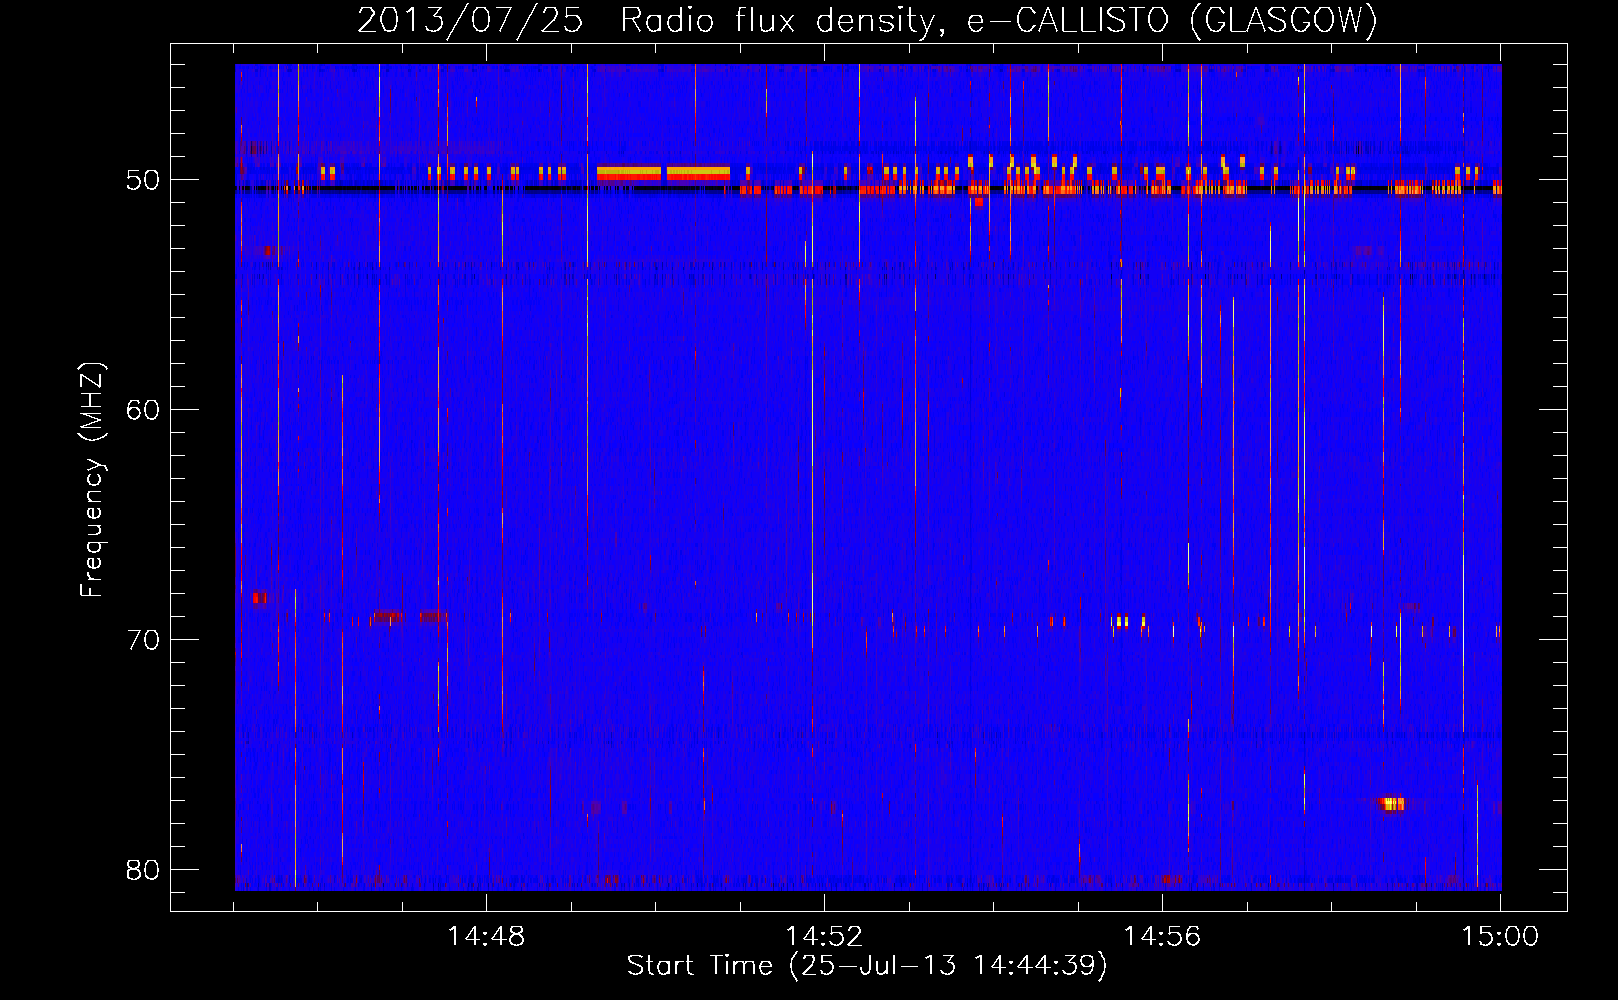
This picture is called a spectrogram. What's it showing? Time increases from left to right, across the picture. The caption at the top tells us that the picture represents events on 25 July, 2013. At the bottom of the picture you can read that the picture starts at 14.45, quarter to three in the afternoon, and that it represents about a quarter of an hour's worth of data, i.e. of measurements of the radio signals arriving at the antenna out at Acre Road.
Each of those vertical streaks is the pulse of radio waves from a bolt of lightning. You've heard the radio when there is lightning, that loud "click". Draw a horizontal line across the picture and each time it crosses one of those vertical lines, that's a lightning strike; a "click" if you're feeding the radio waves to a loudspeaker. For example there was a bolt of lightning just before 14.52. I should emphasise that this is the pulse of radio waves from the lightning strike arriving at the antenna; the lightning itself might be some miles away.
The height at which that horizontal line is placed represents the frequency of the radio waves. For older readers (like myself), we can think of where we stop moving the dial that tunes the radio to a particular station, perhaps the Home Service or the Light Programme, or one of the many more distant and exotic possibilities: Radio Luxembourg, Hilversum , Athlone....
You can read the frequency of the radio waves from the scale at the right-hand side. They lie between 45 and 80 MHz ("megahertz" - Mega, millions, of Hertz, cycles per second). This is quite a nice range: Medium Wave radio stations mostly transmit between 0.1 and 2 MHz, while FM radio stations are mostly between about 85 and 110 MHz. So this range is away from strong, man-made signals and that's why we use it. Across the top of the picture there's a funny, repeating pattern and that's some sort of man-made radio signal, possibly from some sort of electrical machinery rather than a deliberate transmission.
The colours represent how intense the radio waves are (how loud the click would be if we played them through a loudspeaker), at each time and frequency. The blue colour that's mostly there in the background means nothing much is going on. The most intense radio waves are yellow. Looking at that lightning "click" just before 14:52, for instance, it would have been a much quieter click if we had tuned the dial to below 50 MHz or above about 75 MHz, than in between these frequencies.
When I saw this lightning signal it reminded me of the very beginnings of radio astronomy, in 1932 and 1933. Bell Labs wanted to start using radio frequencies of 10s of MHz for communication, but they needed to know what competition radio transmissions would face from natural sources. Karl Jansky, a young physics graduate, was tasked with answering this question. He discovered three natural sources of radio waves at these frequencies. The first is the one we've seen here: nearby thunderstorms, highly variable, intense but short-lived. The second was the weaker, steadier signal from more distant thunderstorms; there's usually thunder happening somewhere. The third, a steady "hiss", was a much more unexpected discovery. Jansky was able to work out that this came from the sky, from a direction that stayed fixed among the stars and seemed to coincide with the direction to the centre of the
Milky Way. "Star static," he called it. This was the first indication that radio waves could tell us something about the universe beyond Earth, although there was only slow progress at first in following up this discovery. Now, of course, radio astronomy is a major branch of the subject. The information it has given us on, e.g. cool gas in interstellar space, neutron stars, or supermassive black holes in other galaxies, could not have been obtained in any other way. The radio wavelengths still have a major role to play in answering the big, fundamental questions of Astronomy, so bigger and more powerful telescopes are still being built, like LOFAR.
Our Callisto receiver's antenna is too wee to detect most cosmic sources but it does pick up what it's meant to: the bursts of intense radio waves that sometimes come from the Sun when there are sunspots, flares etc. These were discovered in February 1942 by J S Hey, an English physicist working on radar during World War II. He soon recognised that this new sort of signal was coming from the Sun, not a German radar jamming technology at all. Jansky would have discovered these solar radio bursts if he hadn't been working at the bottom of the sunspot cycle, when the Sun was not very active at all.
Now that we can understand spectrograms, here's a wee sample, from earlier in July on a day the Sun was particularly busy.
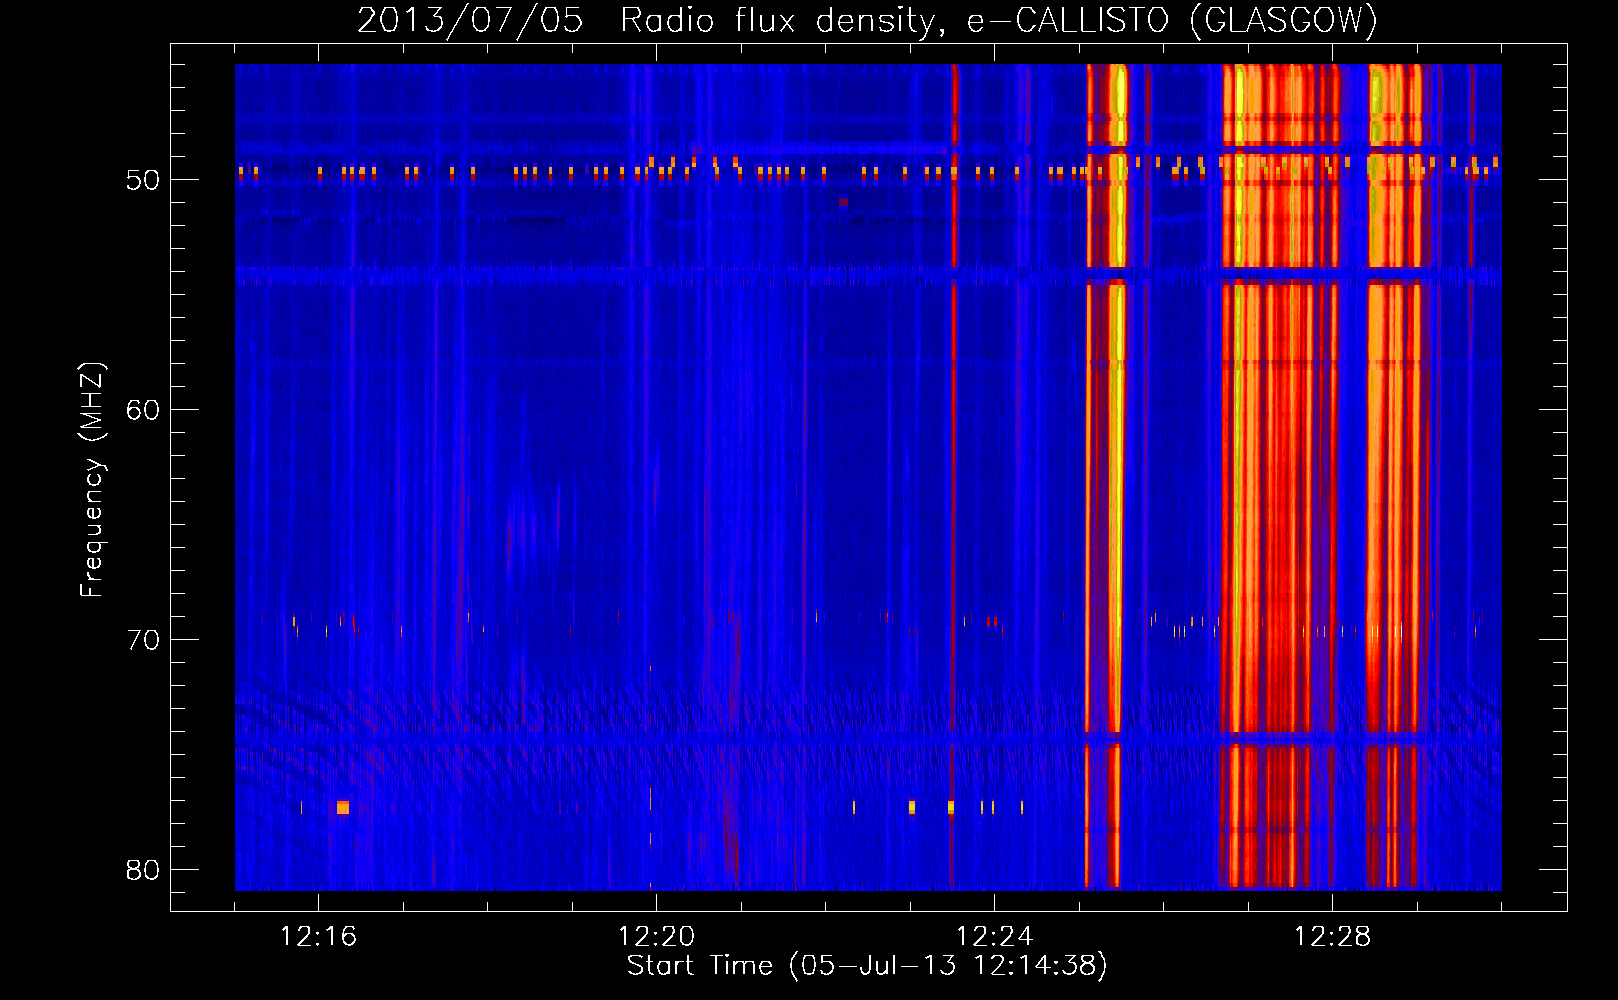 Just one comment just now: the solar radio bursts might look a little bit like very intense versions of the signals we get from thunderstorms on Earth. They're not! They're something quite different that can only happen in the tenuous, high temperature gas of the Sun's outer atmosphere. More in a future blog post.
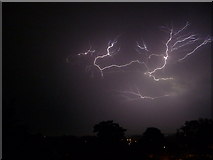
Lastly, here's a nice lightning photo also from July 2103: